Warning: This application note is for learning and development only. It is not for Medical Diagnostic Use. Should be used solely by or under the supervision of qualified engineers and technicians who are familiar with the risks associated with handling electrical circuits.
An electrocardiogram (ECG or EKG, abbreviated from the German Elektrokardiogramm) records the electrical voltage in the heart in the form of a graph. It is the prime tool in cardiac electrophysiology, and its function is in the screening and diagnosis of cardiovascular diseases.
Python and LabVIEW example programs for the EMANT380 Bluetooth DAQ are provided. The folder Python and LabVIEW ECG examples for EMANT380 can be downloaded from info.emant.com (customers access only)
Example programs are intended for experienced Python/LabVIEW users only.
Note:
Pair the EMANT380 to PC.
You must modify the bluetooth MAC address (Python) or COM address (LabView) for your EMANT380 module before running the example. The example is written Bluetooth Starter Kit.
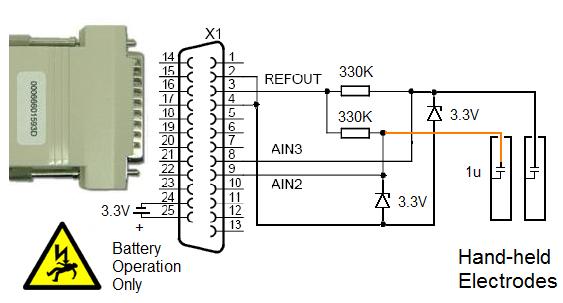
Fig 1: Connecting the EMANT380 Bluetooth DAQ to the Hand-held Biopotential Electrodes Assembly
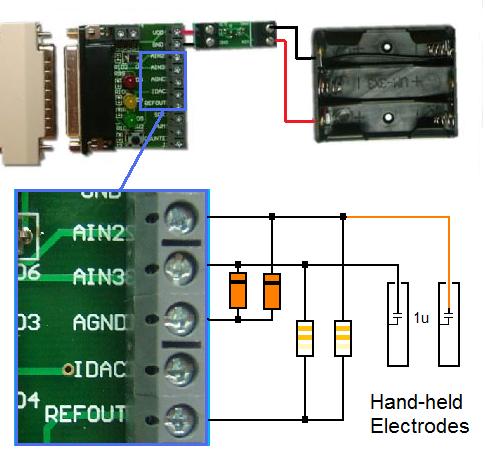
Fig 2: Connecting the Bluetooth Starter Kit to the Hand-held Biopotential Electrodes Assembly
ECG_Scope.py
import matplotlib.pyplot as plt
import time
import random
import math
import emant
from scipy import fft, ifft
MAINS_FREQ = 50
NOTCH_LENGTH_AVERAGE = 4
ScanRate = MAINS_FREQ * NOTCH_LENGTH_AVERAGE
NumSamples = ScanRate * 2 + NOTCH_LENGTH_AVERAGE
def HighPass(ECGdata):
fftECG = fft(ECGdata)
for i in range(len(fftECG)):
if i<8 or i>(NumSamples-NOTCH_LENGTH_AVERAGE-8): fftECG[i]=0
return ifft(fftECG)
def NotchMains(ECGdata):
filteredECG=[]
for i in range(len(ECGdata)-NOTCH_LENGTH_AVERAGE):
filteredECG.append((sum(ECGdata[i:(i+NOTCH_LENGTH_AVERAGE)])/NOTCH_LENGTH_AVERAGE))
return filteredECG
m = emant.Emant300()
#change this mac address to your EMANT380 Bluetooth DAQ module
m.Open("00:06:66:00:A1:D8",True)
print "Hardware Id: " + m.HwId()
r,actScanRate = m.ConfigAnalog(1, emant.Emant300.Bipolar, ScanRate)
print "Actual Scan Rate: " + str(actScanRate)
fig = plt.figure()
ax = fig.add_subplot(3, 1, 1)
bx = fig.add_subplot(3, 1, 2)
cx = fig.add_subplot(3, 1, 3)
# Create a new timer object. Interval set to 2.5 secs
timer = fig.canvas.new_timer(interval=2500)
loop = True
def update_graph(axesa,axesb,axesc):
global timer, loop
if loop:
ECGdata = m.ReadAnalogWaveform(emant.Emant300.AIN2,emant.Emant300.AIN3,NumSamples)
Notchfiltered = NotchMains(ECGdata)
HighPassed = HighPass(Notchfiltered)
axesa.cla()
axesa.plot(ECGdata[10:NumSamples-10]) # update the data
axesb.cla()
axesb.plot(Notchfiltered[10:NumSamples-10])
axesc.cla()
axesc.plot(HighPassed[10:NumSamples-10])
axesa.figure.canvas.draw()
else:
plt.close()
def onclick(event):
global loop
loop = not(event.button==3)
# right mouse click on graph to end program
cid = fig.canvas.mpl_connect('button_press_event', onclick)
# tell the timer what function should be called
timer.add_callback(update_graph, ax, bx, cx)
update_graph(ax,bx,cx)
timer.start()
plt.show()
timer.stop()
m.Close()